LoDo (Lower Downtown)
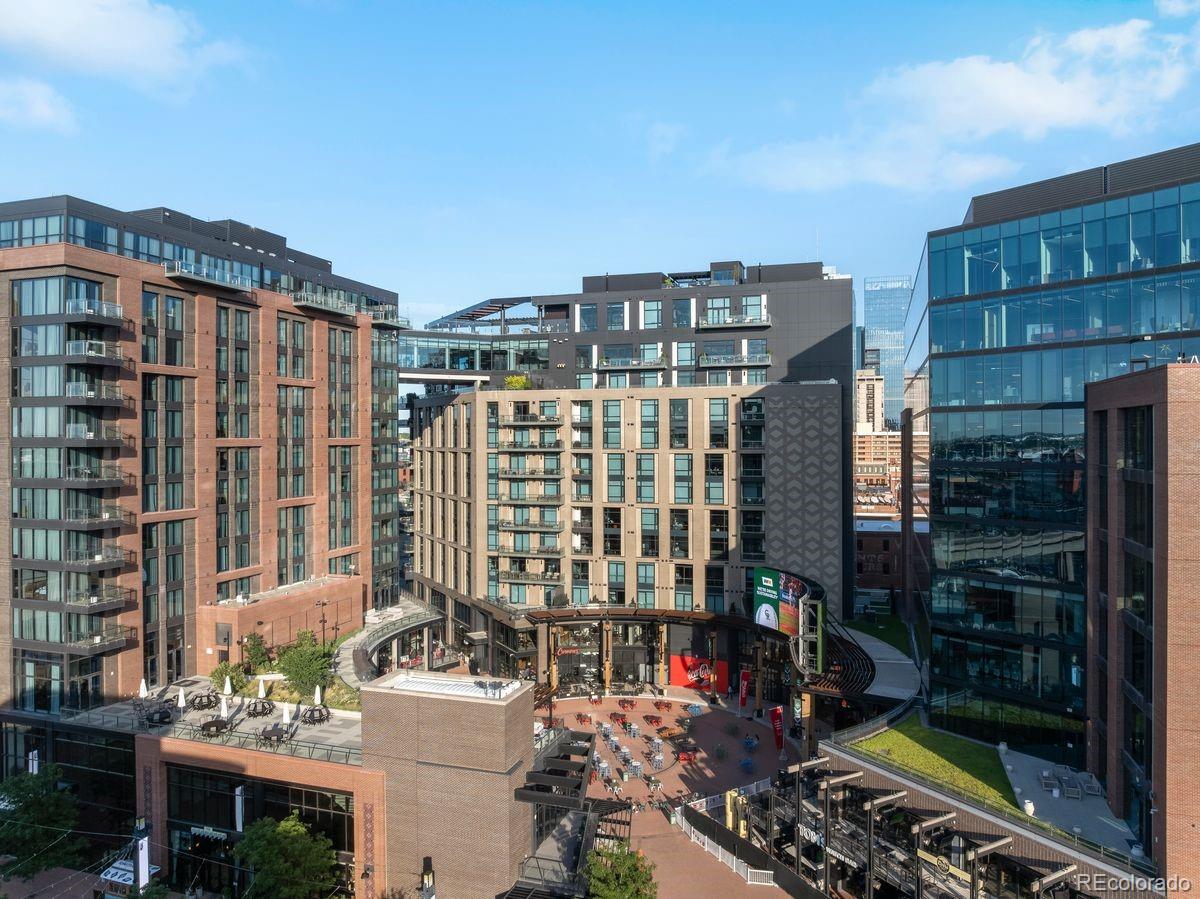
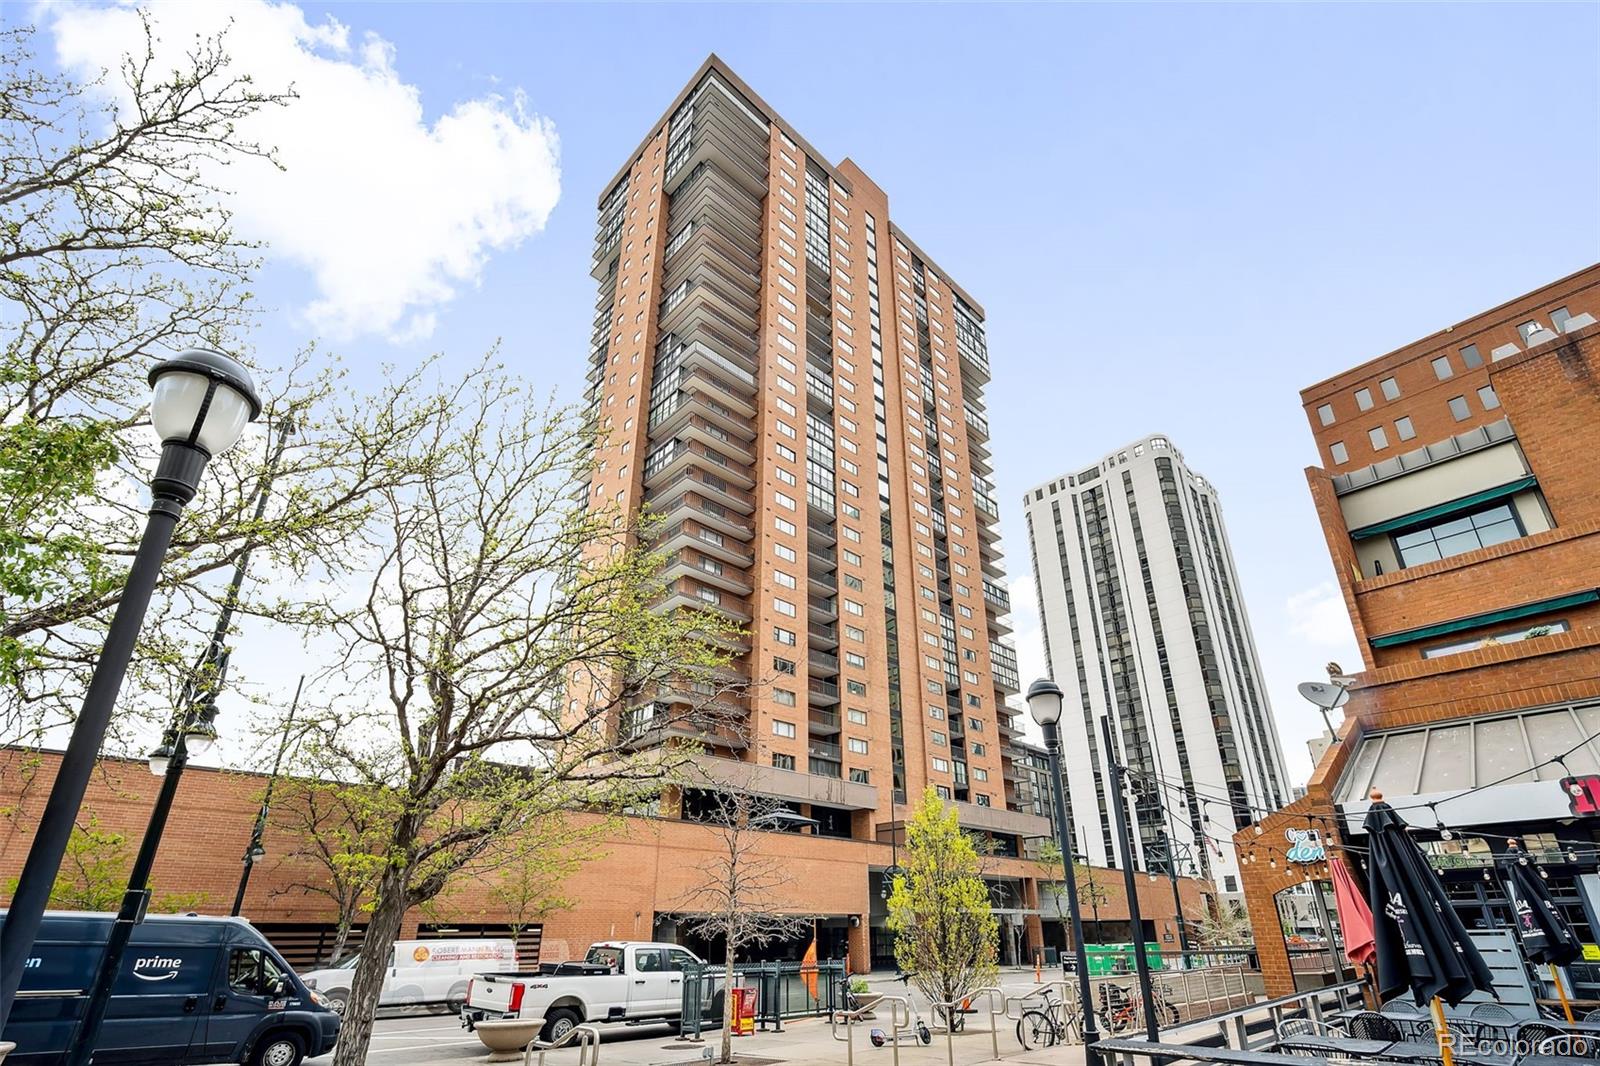
In the heart of lower downtown, where historic Union Station, the 16th Street Mall, and Larimer Square all reside.
In the heart of lower downtown, where historic Union Station, the 16th Street Mall, and Larimer Square all reside.
9,602 people live in LoDo (Lower Downtown), where the median age is 41 and the average individual income is $113,628. Data provided by the U.S. Census Bureau.
Total Population
Median Age
Population Density Population Density This is the number of people per square mile in a neighborhood.
Average individual Income
There's plenty to do around LoDo (Lower Downtown), including shopping, dining, nightlife, parks, and more. Data provided by Walk Score and Yelp.
Explore popular things to do in the area, including Sun Market, 30Forth Kitchen, and Garage1880.
| Name | Category | Distance | Reviews |
Ratings by
Yelp
|
|---|---|---|---|---|
| Dining | 1.58 miles | 17 reviews | 5/5 stars | |
| Dining | 2 miles | 6 reviews | 5/5 stars | |
| Active | 1.51 miles | 9 reviews | 5/5 stars | |
| Active | 3.08 miles | 10 reviews | 5/5 stars | |
| Active | 3.96 miles | 11 reviews | 5/5 stars | |
| Active | 4.57 miles | 5 reviews | 5/5 stars | |
| Active | 2.02 miles | 10 reviews | 5/5 stars | |
| Active | 1.17 miles | 6 reviews | 5/5 stars | |
| Active | 1.53 miles | 9 reviews | 5/5 stars | |
| Active | 1.01 miles | 17 reviews | 4.9/5 stars | |
| Beauty | 2.84 miles | 7 reviews | 5/5 stars | |
| Beauty | 1.99 miles | 7 reviews | 5/5 stars | |
| Beauty | 2.18 miles | 7 reviews | 5/5 stars | |
| Beauty | 1.23 miles | 12 reviews | 5/5 stars | |
| Beauty | 3.14 miles | 12 reviews | 5/5 stars | |
| Beauty | 4.33 miles | 9 reviews | 5/5 stars | |
| Beauty | 3.46 miles | 12 reviews | 4.9/5 stars | |
|
|
||||
|
|
||||
|
|
||||
|
|
||||
|
|
||||
|
|
LoDo (Lower Downtown) has 6,434 households, with an average household size of 1. Data provided by the U.S. Census Bureau. Here’s what the people living in LoDo (Lower Downtown) do for work — and how long it takes them to get there. Data provided by the U.S. Census Bureau. 9,602 people call LoDo (Lower Downtown) home. The population density is 27,618 and the largest age group is Data provided by the U.S. Census Bureau.
Total Population
Population Density Population Density This is the number of people per square mile in a neighborhood.
Median Age
Men vs Women
Population by Age Group
0-9 Years
10-17 Years
18-24 Years
25-64 Years
65-74 Years
75+ Years
Education Level
Total Households
Average Household Size
Average individual Income
Households with Children
With Children:
Without Children:
Marital Status
Blue vs White Collar Workers
Blue Collar:
White Collar:
Browse our comprehensive neighborhood guides to learn more about your desired location.
Get assistance in determining current property value, crafting a competitive offer, writing and negotiating a contract, and much more. Contact Christine today.